A Dismal Guide to DNS
(Originally appeared on Yahoo's Developer Blog)
 The Domain Name System (DNS) is part of the "dark matter" of the internet. It's hard to observe the DNS directly yet it exerts an obscure, pervasive influence without which everything would fly apart. Because it's so difficult to probe people tend to take it for granted, which I think is a mistake. DNS problems can hurt the speed and reliability of your applications without you even noticing. In this article we'll take a look at the behavior of the DNS and walk through some experiments you can run to gather valuable data about your users' network performance.
A Clever Shambles
Before two computers can talk to each other on the 'net, one of them has to know the numeric IP address of the other. Using the DNS is often compared to looking up a number in the phone book. But that can give the impression the information is in one place, close to hand.
Instead, imagine it's 1982. You live in Tucson and you want to call a hotel in Toronto. You don't have a Toronto phone book so you call your local library. They don't have one either. Life is boring in Tucson, so the librarian uses her New York phone book to call another library. The nice lady in New York looks up the hotel's number in her copy of the Toronto phone book, tells it to your local librarian, who then calls back to give it to you. Doing all this is a hassle, so everyone in the chain writes down the number just in case the question ever comes up again.
The DNS is even more complex because of the hierarchy of internet domains. Consider the host name foo.bar.example.net. To look it up your computer will have to look up every part of the name, in reverse order. That means resolving ".", then "net.", then "example.net.", "bar.example.net.", and finally "foo.bar.example.net."[0]. It's not just a matter of finding the Toronto book. It's looking up someone who knows someone who has the Canada book and from there who has the Ontario book, then the Toronto book, and so on.
If this sounds ridiculously complex and fragile, that's because it is. Writing down the answer to common queries, aka caching, is the only reason we're able to get away with it. In practice the root domain "." is known to everyone. During normal operation "net." should be cached all levels including at your local librarian, aka your ISP. Anything beyond that requires some lookups unless the domain is already very well-known.
How long does it take to look up a hostname?
A single DNS lookup may involve several recursive lookups to machines all over the world. Because of this hassle, information is cached for short periods of time at every level, including on your computer. So "the time it takes to do a DNS lookup" can vary wildly depending on the state of affairs in many different places, and the quality of the network connections between them.
On Mac OSX the dscacheutil command will tell you about your computer's latency and cache hit ratio:
$ dscacheutil -statistics
Overall Statistics:
    Average Call Time     - 0.118626
    Cache Hits            - 236152
    Cache Misses          - 231052
    Total External Calls  - 279350

Statistics by procedure:

             Procedure   Cache Hits   Cache Misses   External Calls
    ------------------   ----------   ------------   --------------
         gethostbyname       161252          39952             6749
         gethostbyaddr           60            151              211
         ...
These numbers are interesting but fairly useless for our purposes. It combines cached and uncached lookups into one "average". Also, browsers often cache and even precache DNS information, bypassing whatever the operating system is doing. So we can't rely on what the machine tells us. We need to do some experimenting on our own.
First, I ran long series of tests against Yahoo hostnames from the office, my house, and other locations. For 100 seconds I ran as many DNS lookups as I could and timed them. Each lookup was for a wildcard hostname. A wildcard like *.dnstest.example.net means you can make up random new hostnames on the fly, eg x9zzy.dnstest.example.net, that will resolve to a real IP address. This ensures that each test will be a full end-to-end DNS lookup without any caching to skew the numbers [1].
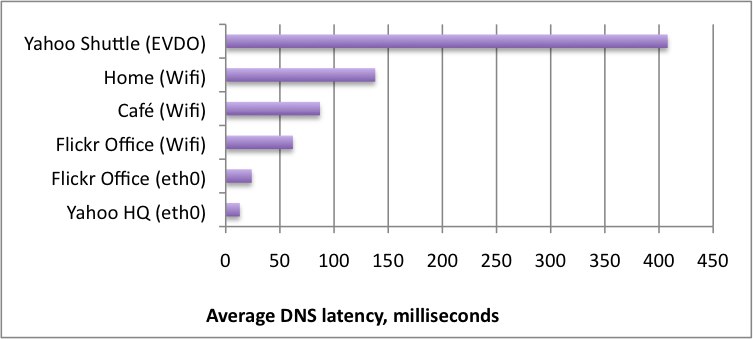
Figure 0: Average DNS latency at various locations
This graph is useful mostly to illustrate that it's possible for users on "broadband" connections to have invisible performance problems related to DNS. But it doesn't tell you which users or how many.
How can we figure out the response time distribution (distribution, not average) for a wide range of users? How can we get a better idea of the role the DNS plays in the performance of web applications? Conditions on the internet change constantly. The tests would have to be large-scale and continuous to mean anything.
Let's scope things down a bit. We don't really care about how quickly users resolve any hostname. We care about how quickly our users resolve our hostnames. So maybe you can get the data you want by observing your users. Unfortunately DNS lookups happen mostly through computers we do not control. Worse, they happen over UDP, which doesn't expose performance data to the callee. The request and response packets are sent without any error correction or acknowledgement. So we can't just look at the usual logs we collect on our servers.
The librarian in New York will never know how long it took the librarian in Tucson to call you back. The hotel staffer in Toronto has no idea how you found their number. That is, unless you tell him. And that's what we'll do: run a special series of tests from the perspective of the caller, ie the users, and report back results.
A DNS Observatory
It's tricky but not impossible to gather some statistics on user DNS latency without running benchmark software on their computers. One way works like this:
") Set up a wildcard hostname, perferably one that does not share cookies with your main site. Give it a low TTL, say, 60 seconds, so you don't pollute downstream caches.
Set up a wildcard hostname, perferably one that does not share cookies with your main site. Give it a low TTL, say, 60 seconds, so you don't pollute downstream caches.
- Set up a webserver for the wildcard hostname that serves zero-byte files as fast as possible. Make sure that KeepAlive, Nagle, and any caching headers are turned off.
- In the footer of the pages in your main site, add a script similar to Listing 1. It performs two HTTP requests:
/A.gifand/B.gif. The first image load, A, will require a full DNS lookup and an HTTP transaction. The second, B, should only involve an HTTP transaction. - Subtract the time it takes to complete B from the time it takes to complete A, and you have a (very) rough idea of how long it took to perform just the DNS lookup.
- Send the DNS and HTTP statistics back to your server as part of another image request. You can extract the results later from your logs.
- Rinse and repeat over a large sample (>10,000) of page views. Millions if you can.
NB: You will get strange, even negative, numbers from this test. The deviation of individual data points can be greater than the phenomenon you are trying to measure. If you want to get accurate numbers for a specific user you'll need to run many tests over a period of time. But a single test per user works well enough in aggregate.
<script>
(function() {
  function dns_test() {
    var random = Math.floor(Math.random()*(2147483647)).toString(36);
    var host = 'http://'+random+".dnstest.example.net";
    var img1 = new Image();
    var img2 = new Image();
    var img3 = new Image();
    var ts = null;
    var stats = {};
    img1.onload = function() {
        stats['dns'] = (new Date()).getTime() - ts;
        ts = (new Date()).getTime();
        img2.src = host + "/B.gif";
    };
    img2.onload = function() {
        stats['http'] = (new Date()).getTime() - ts;
        stats.dns = stats.dns - stats.http; // the clever bit
        img3.src = host + '/dnstest.gif?dns='+stats.dns+'&http='+stats.http;
    };
    ts = (new Date()).getTime();
    img1.src = host + "/A.gif";
  }
  window.setTimeout(dns_test, 11337);
})();
</script>
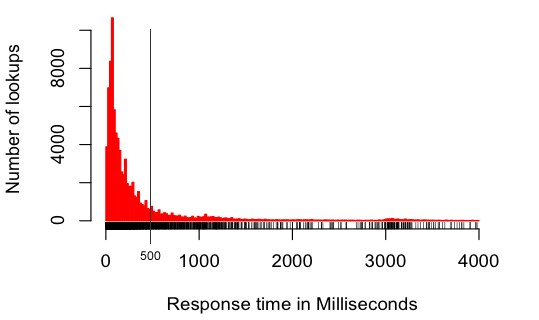
Below is a graph of the distribution of uncached DNS lookup times from real users in the wild, collected by this script over one week. The sample was heavily skewed towards US broadband connections. The median was 146 milliseconds and the geometric mean was 163 milliseconds [2]. This is rather larger than the 20-120 milliseconds quoted in the Yahoo Performance Guidelines for a "typical" DNS lookup. Beware pithy numbers (even ours).
The distribution is even more interesting than the averages. Twenty percent of users in our sample took more than 500 milliseconds just to resolve one hostname. Granted, these lookups were uncached. Assuming a 50% cache hit rate, that's still one out of ten users in this dataset laboring under crappy DNS performance. As of this writing that's a market as large as Safari, Chrome and Opera combined.
The cause is unclear. It's possible that user network quality is just that bad. It could be physical distance. It could also be the DNS resolvers of ISPs at fault. It could be your DNS server. Or it could be something else. Or all of the above.
Remember that your mileage may vary. Not every combination of site and userbase will have a similar graph. Also remember that a lot of caching is going on at every level of the system. There's not a simple fixed cost to using alternate hosts for your images and scripts. The best strategy may well be to have one and only one "asset host" or CDN that does not share cookies with your main site.
If you run a commercial website, consider setting up with a dedicated DNS hosting provider that has presence on several continents. The DNS hosting service typically thrown in for free by domain registrars is not very good. For most sites, solid DNS hosting costs about $USD 50 per year. It's worth the effort. Heck, set up with two different services for failover.
Try this at home
For privacy reasons we can't release the raw data we collected. But if you have a website with a fair amount of traffic, I strongly encourage you to run these DNS measurements for yourself. You can learn a lot by drilling down into the data.
- Play with graphing the distributions of different subnets (eg 18.* for MIT or 12.* for AT&T). You might be surprised at who is fast and who is slow.
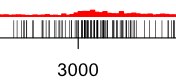 In your webserver logs for /dnstest.gif there should be a User-Agent field as well. So you can look at correlations between DNS performance, browsers, and operating systems. For example, check out those little bumps at 1s and 3s in Figure 1. It turns out that the DNS resolver in Windows has aggressive timeouts. Those bumps are caused by Windows clients timing out then succeeding on a retry.
- We're not just timing DNS latency, we're also timing how long it takes to perform a minimal TCP handshake + HTTP transaction. That gives you interesting information about user connection latencies, for free. But that's a whole 'nother subject.
This article is the second in a series and part of ongoing research on web app performance. If you have any suggestions or ideas to help improve the experiments, please leave a note in the comments. Next we hope to dig into more detail about user network performance data and how you can use it to improve your websites and applications.
Notes
[0] The dot "." at the end is not a typo. Though "com" and "net" are called "top-level" domains there is actually one more layer behind them called the root domain, designated by that trailing dot. The root domain is managed as a global public utility by dozens of internet service providers all over the world.
Fun fact: the entire country of Sweden dropped off the 'net in October 2009 because a network operator forgot to include that last dot in a configuration file.
[1] I'm fudging here a bit. It's possible that during this test, everything up to .dnstest.example.net will be cached at the user's ISP. This is by design, to reduce load on the root and top-level domain servers. But the lookup should always at least do a request to the ISP's resolver and a request in turn to example.net's authoritative DNS server.
[2] These kinds of datasets tend to be log-normal, with long thin tails trailing from a large central spike. The "average" value, or arithmetic mean, would be misleading in this case so we won't discuss it.
[∞] Bonus footnote! Here is the code to generate a table from your webserver logs:
# run a grep for "/dnstest.gif" and save to a file
bzcat /your/apache/logs/access_log.*.txt.bz2 | grep dnstest.gif > /tmp/dnstest.log

# perl magic to split the data into columns
echo "A,B,C,D,dns,http" > latency.csv
perl -lane 'if (/^([\d]+)\.([\d]+)\.([\d]+)\.([\d]+).+dns=(\d+)\&http=(\d+)/) { print "$1,$2,$3,$4,$5,$6" }' dnstest.log >> latency.csv
Here are the R commands to generate graphs and poke around at the data. If you've never tried R, it is a wonderful open-source statistics suite. The best introduction on how to use it is here. (PDF)
## R script for generating the histogram
x <- read.csv("latency.csv", header=TRUE)

# take only results greater than 0 and less than 4,000
y <- subset(x, (x$dns > 0 & x$dns < 4000))

# draw the histogram
hist(y$dns, xlab="Milliseconds", main=NA, breaks=200, col="red", border="red", prob=FALSE)

# rug() adds "tassles" to the bottom of the graph to show data point density.
# rug() makes tassles. Get it? Yeah.
rug(sample(y$dns, 5000))


## bonus bonus: more interesting stats

# Show only requests from Brazil. this filter is not strictly true
# (ie, they have more subnets than 200/8) but it's true enough to play with.
brazil = subset(y, (y$A==200))
hist(brazil$dns, xlab="Milliseconds", main="Brazil (200.*)", breaks=200, col="green", border="green", prob=FALSE)
rug(sample(brazil$dns, 5000))

## other interesting subnets
mit = subset(y, (y$A==18))
att = subset(y, (y$A==12))

# the "average" is not very useful with log-normal datasets
#mean(y$dns)

# median and geometric mean are more informative
median(y$dns)
exp(mean(log(y$dns)))

# percentage of users over / under a specific point
table(y$dns > 250) / length(y$dns)
table(y$dns > 500) / length(y$dns)