Measuring Javascript Parse and Load
Any savvy web developer can tell you how many kilobytes their code consumes. They bundle, minify, compress and tune the data sent out to within an inch of its life. Wire weight is easy to measure and has a direct impact on your application's launch time. But how many milliseconds does it take the user's computer to parse and load your code once it's arrived? What differences are there between CPUs, operating systems, browsers and plugins? What speed leaks are we overlooking?
The Test
As you look at the data below, keep in mind four things:
- Your code is not the only code running on the user's computer
- Parse-n-load time comes down to available CPU cycles and RAM
- The fastest CPUs aren't getting much faster
- The average consumer CPU is getting slower
Even if you look at just sexy new hardware it's hard to ignore low-power clients: there are about 50 million netbooks and 43 million iPhones out there, alongside 10-15 million Android devices. Almost all of them are in the 600-1,600 MHz range and have less than 512MB of RAM. A juicy, growing slice of the market wants to use your software on the equivalent of a desktop from 1998. This includes rich Westerners as well as people in the fastest-growing international markets.
The test harness loads a given block of Javascript from a local file over and over and measures the setup time. My test subjects were the Yahoo User Interface (YUI) libraries, Scriptaculous, and jQuery UI. I've also included the main Javascript application code from GitHub.
The core test is as simple as can be: record a start time, load the script, record the end time, and repeat over 1,000 iterations. The tests were run on recently-booted machines with no other programs running. You can check out the project on GitHub and play along at home.
The Libraries
- YUI 2.8.0r4, 390KB partial (dom, event, datasource, datatable, layout, tabview, treeview, menu)
- YUI 3.0 build 1549, 311KB "kitchen sink"
- Scriptaculous 1.8.3, 159KB "kitchen sink"
- jQuery UI 1.7.2, 359KB "kitchen sink", minus translations
- GitHub.com 09 Feb 2010, 211KB main application code, including jQuery 1.4
The point of this benchmark is to compare browsers and CPUs. Comparing the parse-n-load of different libraries puts you on shaky ground. For example, the YUI2 libraries are as of this writing more comprehensive than, say, YUI3 or Scriptaculous. On the other hand it's rare for an application to load every module as we're doing here. Also, each library has a diffferent approach to initialization. YUI2 does a lot of work up-front while YUI3 does things more lazily. From there you get into a complex question about what benefits each library buys you. Do not base the choice of library on this benchmark.
MacBook Pro 2.26GHz, OSX 10.5.8
| Chrome | Safari 4 | Firefox 3 | Firefox 3.5 | Firefox 3.6 | Opera 10 | Safari 3 | |
|---|---|---|---|---|---|---|---|
| YUI3 | |||||||
| YUI2 | |||||||
| Scriptaculous | |||||||
| jQuery UI | |||||||
| GitHub |
Table 0: Parse-and-load times in milliseconds for various Javascript libraries and browsers, 95th percentile mean. MacBook Pro 2.26 GHz Intel Core 2 Duo with 4GB of 1GHz DDR3 RAM.
Presario R3000 1.6GHz, WinXP SP3
| Chrome | Firefox 3 | Firefox 3.5 | Firefox 3.6 | IE 6 | IE 7 | IE 8 | |
|---|---|---|---|---|---|---|---|
| YUI3 (raw) | |||||||
| YUI3 | |||||||
| YUI2 (raw) | |||||||
| YUI2 | |||||||
| Scriptaculous | |||||||
| jQuery UI | |||||||
| GitHub |
Table 1: Parse-and-load, 95th percentile mean. Compaq Presario R3000 at 1.6GHz, Windows XP SP3 and 512MB RAM.
MacBook Air 1.6GHz, OSX 10.5.8
| Chrome | Safari 4 | Firefox 3 | Firefox 3.5 | Firefox 3.6 | |
|---|---|---|---|---|---|
| YUI3 (raw) | |||||
| YUI3 | |||||
| YUI2 (raw) | |||||
| YUI2 | |||||
| Scriptaculous | |||||
| jQuery UI | |||||
| GitHub |
Table 2: Parse-and-load, 95th percentile mean. MacBook Air 1.6 GHz Intel Core 2 Duo with 2GB of 1GHz DDR2 RAM.
NB: the MacBook Air had overheating problems so some of these numbers in this table may be skewed upwards. On the other hand, that's precisely the kind of crap your users have to deal with.
So it seems that there is a measurable cost to parse-n-load, and parsing speed does not seem to be correlated with the speed of the interpreter or DOM. Chrome has some anomalies in the data so for now I am withholding judgement. See "Curious Case of Chrome" in the appendix.
There is a noticeable spread between different browsers on the same hardware and OS. Firefox 3.5 is a few points slower than 3.0, but 3.6 improved on that. Internet Explorer is surprisingly fast at parse-n-load across all tested versions. I didn't include standard deviations because aside from some pathological cases they were small. If you run the benchmark for yourself you will get mean average, stddev, and a time series graph for your enjoyment.
Minification FTW
Here is a comparison of the YUI libraries in "raw" form (with comments, whitespace, etc) and the same code minified using YUI Compressor. As expected, minification helps parse-n-load in addition to network transmission time. This is probably due to the absence of comments and extra whitespace.
| Chrome | Firefox 3 | Firefox 3.5 | Firefox 3.6 | IE 6 | IE 7 | IE 8 | |
|---|---|---|---|---|---|---|---|
| YUI3 (raw) | |||||||
| YUI3 (minified) | |||||||
| YUI2 (raw) | |||||||
| YUI2 (minified) | |||||||
Table 3: Code minified with YUI Compressor temds to parse faster.
So What?
If you have a large amount of Javascript in your application it's natural to bundle it all up into one file to save on network transit time and increase cacheability. But if certain parts of your application only use certain parts of the bundle, you might cause the user to unnecessarily parse unused code on every page load. The ideal would be to decouple three things that are now tightly wound together: network transit, parse-n-load, and cacheability. There is a lot of work going on in this space but so far there is no silver bullet.
- Alexander Limi from Mozilla has a proposal to use zip files for bundling.
- The folks at 280North have found a neat way to do multi-file bundling in their Cappuccino framework, using existing technology.
- Google is proposing an extension to HTTPS that allows multiple concurrent streams over a single TCP connection.
- SproutCore and the Google Mobile Team recently demonstrated ways to load Javascript code as dumb strings that is evaluated at a time of the programmer's choosing.
Try this at home
The Parse-N-Load benchmark is open source and free for use. It's early and I'm sure there are bugs. If you have other kinds of hardware (Netbooks! Windows! Linux!), please try it out and let me know what you find.
Appendix
The Curious Case of Chrome
While Google Chrome appears to be an order of magnitude faster at parse-n-load, the truth may be a little more complex. Running this benchmark in Chrome sometimes produces sharp cliffs in the time series graph, especially on slower CPUs. That might be the V8 engine's inline caching kicking in. I also suspect it could be caching the machine code it compiles on the first pass. Or this could be something silly like the CPU coming out of low-power mode. If anyone who knows more about what's going on can speak up, please do.

Debugging the Benchmark
The first problem that came up was different blocking behavior between browsers. In Safari 4 (but not 3) if you create a script tag that points to an external file, that action will block, ie, wait until that file is completely parsed and loaded. This makes timing it very easy. In Firefox, however, this action asynchronous: the statement that creates the script element returns immediately and the file is loaded in a separate thread. This means you have to set up a callback in the separate thread to both measure elapsed time and kick off the next iteration of the test. You have to be careful not the blow the stack with too many nested function calls. Google Chrome is also asynchronous and has an altogether different stack behavior. If all that wasn't enough, browsers have very different memory allocation behavior, of which more (oh, much more) below.
Adventures in Garbage Collecting
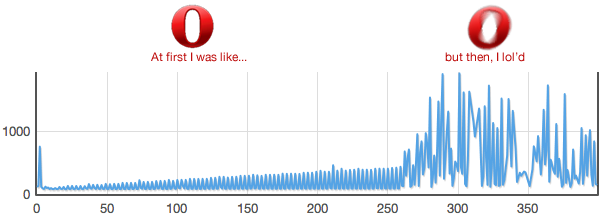
Every browser seems to have a different system for allocating memory while parsing Javascript code. When you graph the results from Safari 4 this is what I saw initially:
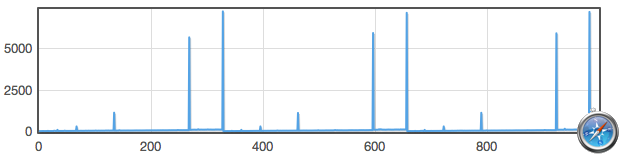
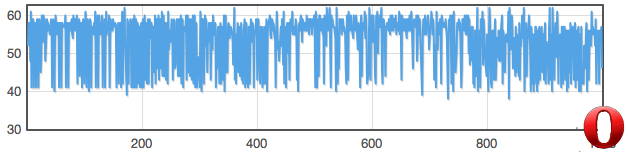
Interesting. All of the source files in the benchmark are local so that's not I/O wait. The regularity of huge spikes suggests that the browser is pausing every so often to free up memory via garbage collection. When you remove those spikes another interesting pattern shows up. Here is the same graph with the top 5% of datapoints removed:
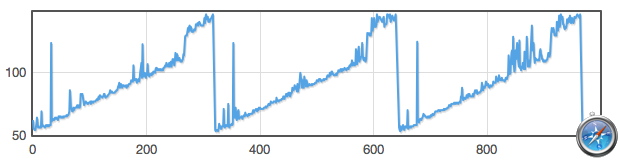
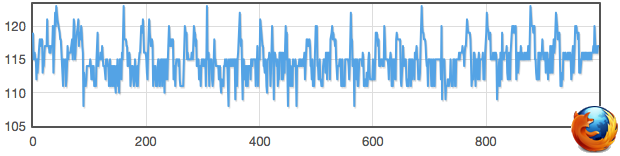
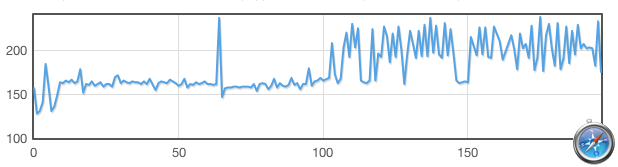
It appears that the parse-n-load time of a given piece of Javascript in Safari 4 will increase linearly with the amount of garbage. The load time can grow as much as 3X longer than normal before GC kicks in. I'm not certain whether this is an artifact of the benchmark or if it actually happens a lot during real-world use. When I added code to explicitly delete the previous script tag before creating a new one, the sawtooth elongated but did not go away. Other browsers exhibit similar halt-the-world GC behavior but only Safari 4 and Opera 10.5alpha have this sawtooth. Firefox's graph stays fairly horizontal but has many more small spikes:
A Tragic Opera (updated)
Initially results for Opera 10.0 had asterisks because I couldn't get it to run the complete test. Opera got steadily slower up to 250 iterations after which it started serious thrashing and had to be killed. Geoffrey Sneddon from Opera software kindly suggested an alternate way to run this benchmark, ie destroying and re-creating the iframe for each trial instead of overwriting the same document object. This new method (dubbed "v2") works well and the Opera column has been updated. New test runs against the other browsers did not move their 95th percentile numbers more than a few percent, though the standard deviations and number of GC pauses did decrease.
Geoffrey also mentioned that while the condition I triggered is rare in the wild, they will work to fix it in a future release.
Safari 3 hit the wall even earlier, triggering an Out-of-Memory error after just a couple hundred iterations. The v2 of the benchmark works much better.

Many thanks to Adrien Arculeo, Ryan Tomayko (GitHub), Geoffrey Sneddon (Opera Software), Robert Halliday (Yahoo), Eric Miraglia (Yahoo), Lucas Smith (Yahoo), and random internet heroes for their help, ideas and corrections.